Supercharging your Employee Survey with Predictive Analytics
In this article, I’ll do my best to explain what predictive analytics are and how they can be used to get value from an employee survey, by making more informed decisions. I’m not a data scientist, so I’ll describe all of this in terms that I understand and hope that you will too!
What is Predictive Analytics?
As the name suggests, Predictive Analytics is about understanding what might happen, based on the analysis of historical data. Before we step into more detail, let’s compare Predictive Analytics to other forms of data analysis.
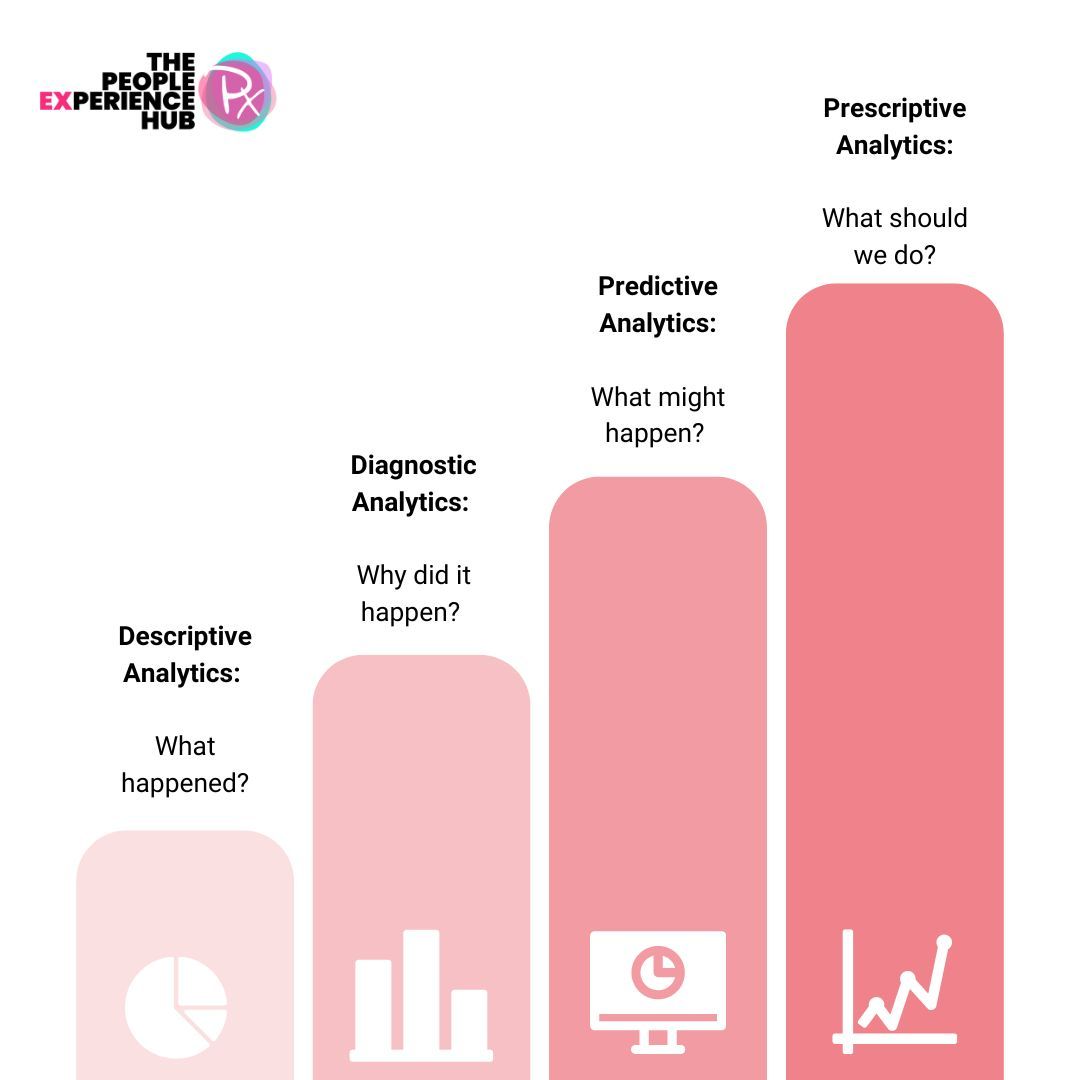
Four Types of Data Analytics
The most basic form of data analysis is Descriptive Analytics. Most charts and graphs that you’ll see on an employee survey dashboard falls into this category. Simply, it’s describing what has happened, often breaking it down into categories, showing highs and lows or averages, and perhaps trends over time. The fundamentals, if you like.
Next is Diagnostic Analytics. If Descriptive Analytics are telling you what happened, then Diagnostic Analytics help you understand why.
This means introducing inferential statistics. Inferential statistics use formulae to better understand differences (such as engagement scores for males versus females) or relationships (say between line management and engagement) between variables, and whether it is reasonable to conclude that they are “statistically significant” (normally meaning that there is less than a 5% probability that it is due to chance).
The third level is Predictive Analytics. Fundamentally, the difference between Diagnostic and Predictive Analytics is how you are using them, or another way of putting this is the question that you are asking of them. Now, the focus is what might happen.
Finally, there is Prescriptive Analytics. This means using the data to create recommendations. This involves using AI/Machine Learning, to augment (and hopefully not replace) human judgement. Essentially, this is similar in principle to sharing results with ChatGPT and letting is scour the internet for ideas (though in practice it’s normally more controlled than this!).
For more details on these, check out his blog from Harvard Business School.
How Do We Use Predictive Analytics to Improve Insights from Employee Surveys?
The main use of Predictive Analytics in our Employee Surveys is to analyse the drivers of an outcome, such as Employee Engagement or Wellbeing. This is designed to help you prioritise your actions, based on the factors that are most likely to have a positive impact on engagement.
Without some form of drivers analysis, there’s no clear connection between the questions that you are asking about the organisation, and the questions that relate to engagement (or the other outcome).
In that case, it’s inevitable that you will be drawn towards your highest (and even more so) lowest results, when deciding how to act. While there may be good reasons for dealing with your lowest scoring questions, for example poorly perceived processes are probably costing you time and money, if you’re interested in improving engagement you really want to know what’s most likely to make a difference to it.
This is where Predictive Analytics comes in, most usually in the form of a linear regression (there are other types of regression, which we’ll come back to).
Why is Regression better than Correlation for Understanding Engagement Drivers?
We’ve seen drivers analyses that use a correlation matrix. This means that for each question or theme, the correlation (statistical relationship) between that question and the engagement outcome, is calculated and then ranked in some way.
What’s the problem with that, you might ask?
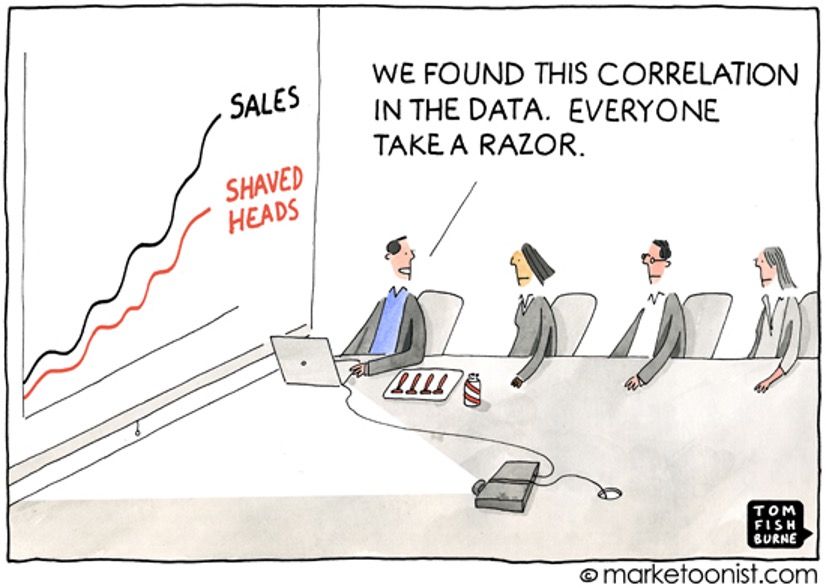
(And check out these spurious correlations 😊)
So, let’s say that a supportive line manager is correlated with engagement. And, say, perceptions of HR policies.
It’s also logical to think that HR policies are more positively perceived by people who have a supportive line manager.
So what’s really going on here: Which of these is really driving engagement?
This is the question that linear regression tries to answer. You chuck a load of correlations into the mix and it looks at which of them best predict the outcome, and which are merely associations (or side effects).
So, if people perceive HR policy positively because they have a supportive manager, then we’d expect a supportive manager to show up as a driver of engagement, using regression, whereas HR policies might not.
Their relationship with engagement might be a side effect and regression will show if this is the case, while correlation will not.
So (and again, while there might be many good reasons to improve your HR policies), if you are only looking at what will improve engagement then you will prioritise line management development when choosing where to put your limited resources.
What are the Benefits of Predictive Analytics?
Predictive Analytics Support Better Actions
Quite simply, the core benefit of Predictive Analytics is better decision-making, which leads to better action and, as you know, that’s the point of running an employee survey in the first place.
In the example we just used, there’s still a lot of judgement required before you make your decision to invest in management development over HR policy improvement.
First, and as I’ve already mentioned, there are different outcomes to consider, not only engagement.
Second, Predictive Analytics don’t take into account your budgets, your capabilities or your overall strategy. If you could feed an AI algorithm costs, benefits and other constraints, a Prescriptive model could make clearer recommendations.
Right now though, for most of us, that’s human work (supported by tools and technologies).
But the point is, without predictive analytics, your survey results read more like a shopping list, and it’s not necessarily in any order of priority.
Predictive Analytics Help Make Your Business Case
The other key benefit of using predictive analytics is to be able to present a clearer case for investing in initiatives on the back of survey data. Not just which to go for, but why you should.
Performing a regression analysis, like a correlation, highlights the relative influence of each variable on the outcome. If we can quantify that, we at least have some idea of the magnitude of impact that an initiative will have – even if it is only on engagement outcomes (in a perfect world, we’d use performance data!).
Indeed, by introducing more forms of data, such as retention statistics and costs, it’s possible to go further and start quantifying those benefits in financial terms.
How Do We Use Predictive Analytics in Our Surveys?
It’s fair to say that our Predictive Analytics journey has a long way to go, but we are doing a few things right now.
First of all, we’re doing drivers analysis. But we’ve taken an extra couple of steps.
Px3 and Path Analysis
Our Px3 Framework enables us to design and analyse surveys on three levels: How our perceptions of the work environment change the way we feel at work, and how that impacts upon engagement (or other outcomes such as wellbeing).
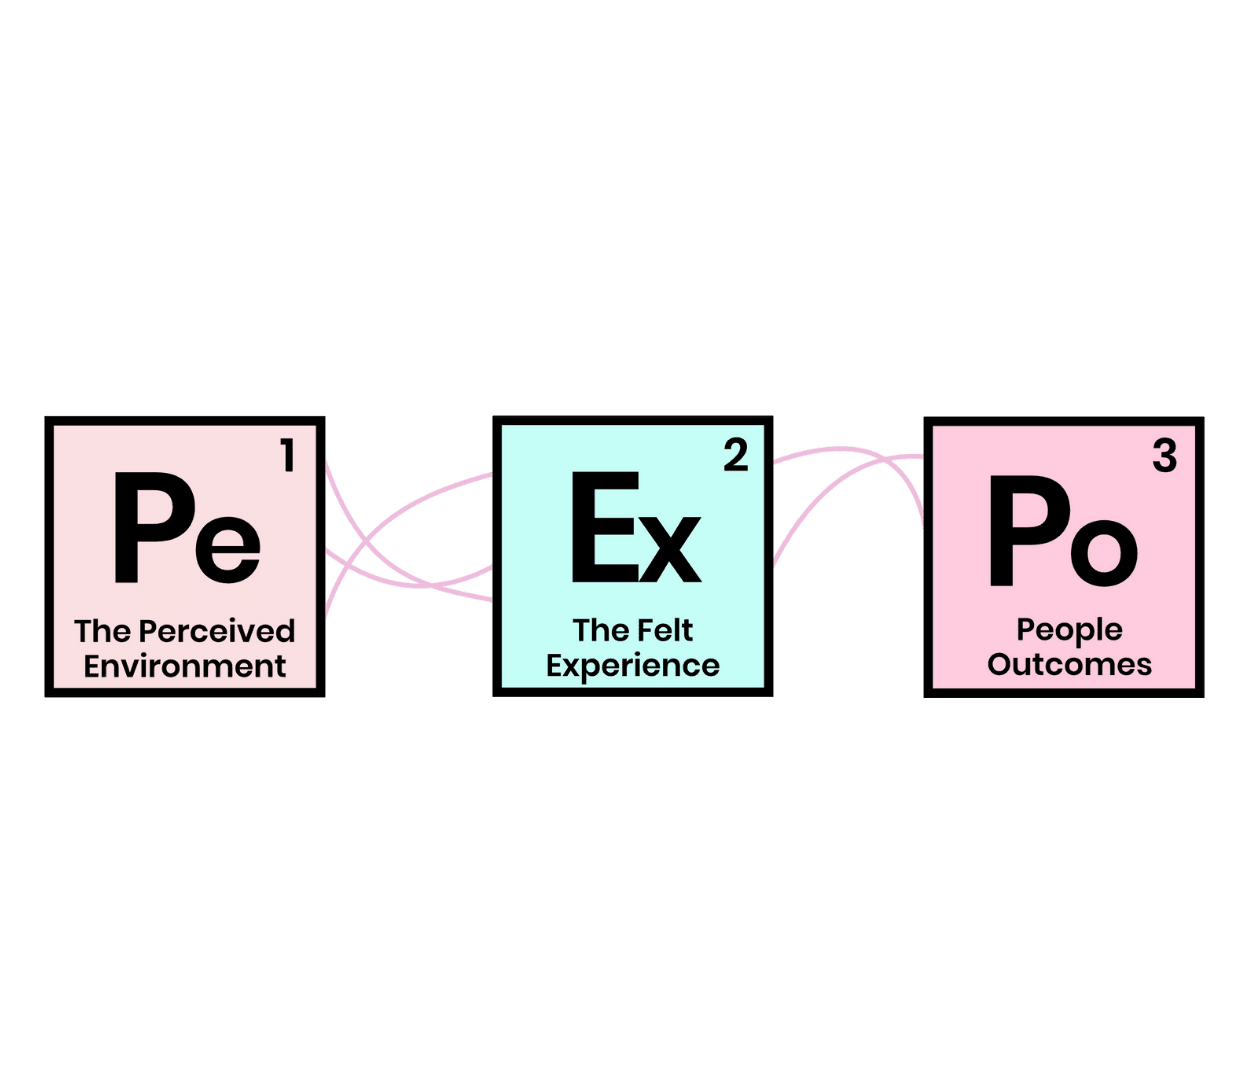
The ‘path’ that we can plot through these three levels uses a form of regression called a path or mediation analysis. While it gives us the same ability to see the relative influence of environmental drivers on engagement, it also tells us HOW they influence it, for example through feelings of belonging, growth or purpose.
We do this for two main reasons, really for the benefit of EX / OD / Engagement specialists:
- It feels more realistic to understand the organisation as more of a human system, even if it’s still a simplification of it. This provides deeper insights into what’s going on, and how it might be impacting organisational performance, as well as making it easier to tell the ‘story’ behind the data.
- It provides two different routes into engagement. On one level, the list of drivers and their relative scores provides a direct route into action. On another, understanding how different feelings (or human needs) influence engagement provides a focal point for further investigation and dialogue.
Other Applications of Predictive Analytics
We’re also experimenting with different kinds of regression, such as logistic regression, which enables us to understand how the people experience is different, and what impact that is having, for people who are (say) actively engaged or actively disengaged.
And this leads us into all sorts of other potentially exciting applications of predictive analytics and AI that we believe will really help supercharge the value provided by employee surveys, on their own and by pulling in other sources of data.
And then, by creating feedback loops based on real actions taken we can go to the next level, Prescriptive Analytics.
But the detail of what we’re up to, I’m afraid, have to remain top secret for now. In fact, this article will self-destruct in 10-9-8-7-6-5…….
For a better understanding and answers to your questions, get in touch here